
AI-driven engineering, research, and consulting. We create practical solutions for real-world business challenges.
What We Do
Most businesses know AI matters. Far fewer know how to make it actually work. BlackBox AI bridges that gap — combining strategic consultancy with hands-on engineering to take you from first idea to production-ready system. No vague reports, no vendor juggling. Just end-to-end delivery from a team that builds what it recommends.
We build working AI systems end-to-end — machine learning models, APIs, cloud infrastructure, and integrations — delivered in agile sprints with a full handover your team can run independently.
Portfolio
Research Projects
Each project trials a specific AI use case or emerging technology — so we understand what's coming before it hits the mainstream, and our clients benefit from real-world insight, not just what's already here.
Hardware
EdgeSense
AI Use Case
What are the limitation of using Local AI with real-time sensor data?
Desktop Software
H I V E - Synthetic Environments
AI Use Case
How can we generate synthetic sensor data for model training?
Machine Learning
Edge AI using LLMs
AI Use Case
What are the capabilities and limitations of Edge AI Hardware?
Data Analysis
Hardware Development TestBed
AI Use Case
How can physical hardware be used to test AI capabilities?
AI/ML
Host Buddy
AI Use Case
How can hosting and sharing AI apps be made simpler?
Web App
Brain
AI Use Case
How can large volumes of data be efficiently utilised by AI?
Web App
BlackBoxAI Website
AI Use Case
How can user feedback be automated using agentic development ?
Web App
Network Influencer - Micro SaaS
AI Use Case
How effective is AI at cleaning and enriching large datasets?
Web App
PlanPilot
AI Use Case
How effective is prompt injection requiring strict AI responses?
Activity
Recent Activity
Updates, features & bugs across all projects — last 90 days
How We Help
Expert Consulting
Good AI strategy starts with honest advice from people who've actually built real systems. Whether you need a Discovery Workshop to find your footing or an ongoing retainer to keep things moving, we help you make confident decisions — without the guesswork or the jargon.

Service
Build Sprint: 4 to 6 Weeks

Service
Team AI Enablement Workshop - Half Day or Full Day
Service
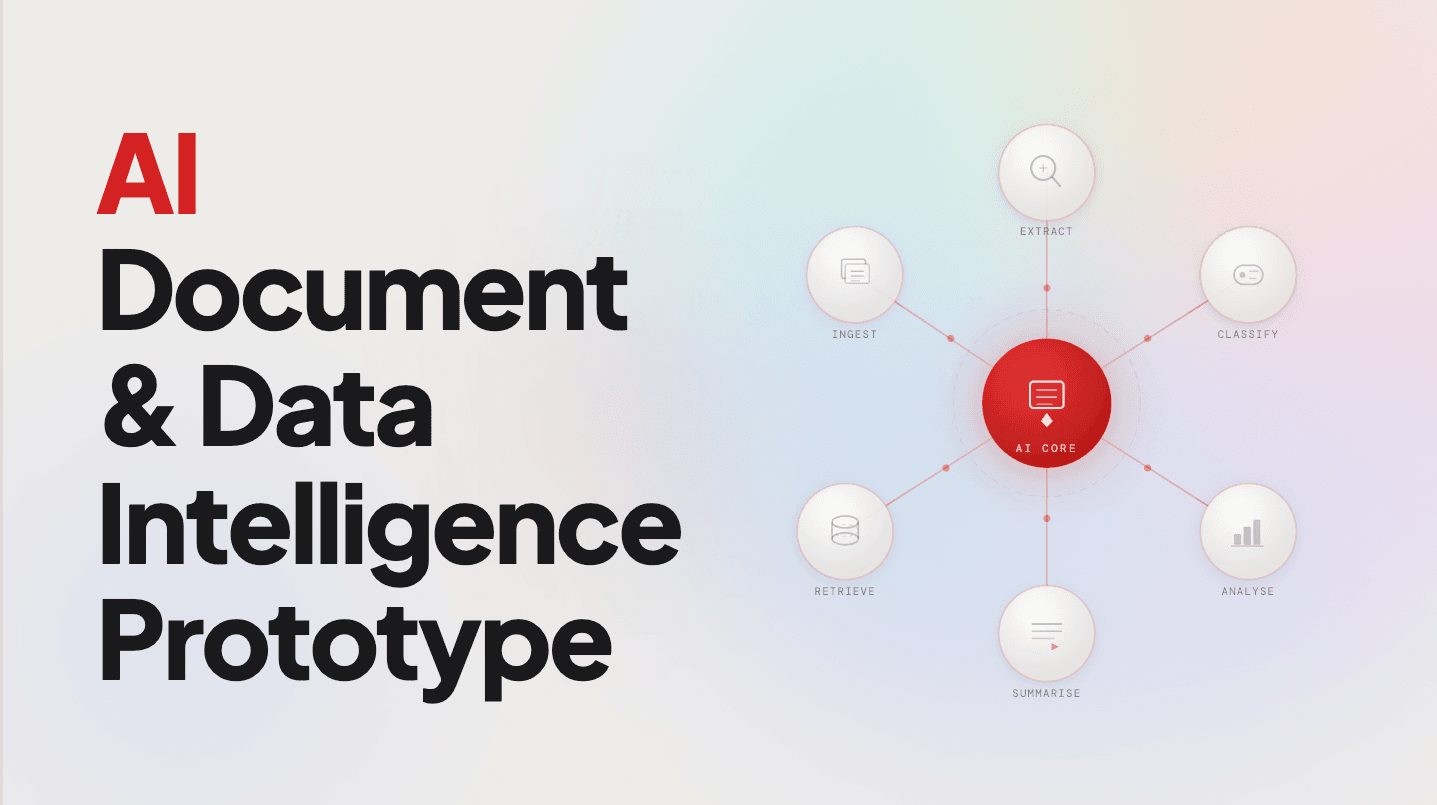
AI Document & Data Intelligence Prototype - 5 Days

Service
AI Workflow Discovery Sprint

Service
AI-Ready KPI Dashboard

Service